

Disaster and health authorities wielding a dynamic analytical tool would be better equipped to make lifesaving decisions during heatwave, bushfire or flood emergencies, according to a new Australian Catholic University study.
Public health and major infrastructure bosses would also benefit from the Bubble-Wall Plot, a data visualisation tool designed to capture, analyse and display information simply to assist hazard management in real time.
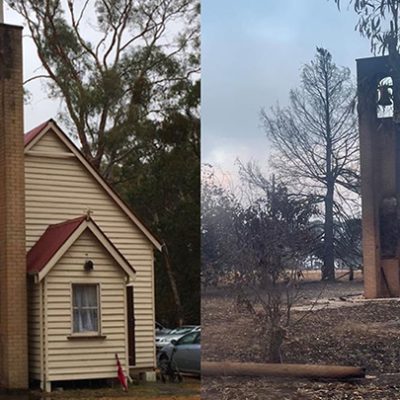
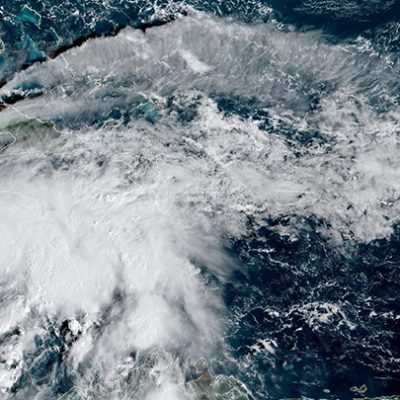
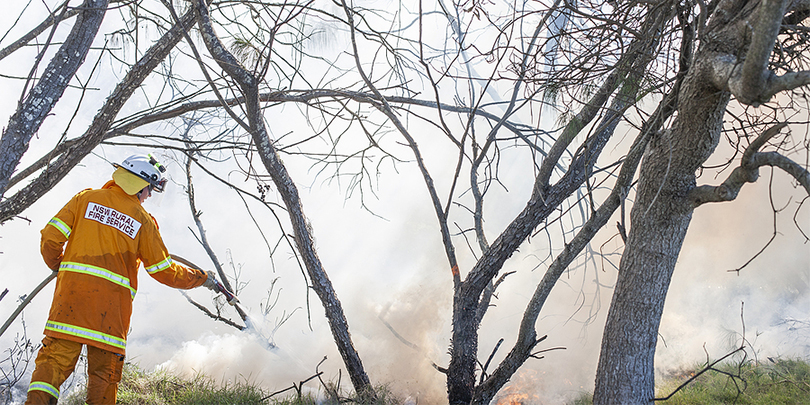
The study’s co-author, ACU IT head of discipline Niusha Shafiabady, said the innovative system could be applied to save lives in the next bushfire, heatwave, flood or mining disaster.
“We’ve built a visualisation tool that doesn’t just show data – it warns you when danger is rising,” Professor Shafiabady said.
The Bubble-Wall Plot is a one-dimensional chart that maps a target variable within a safe range.
A circle represents the status of the variable. Once the variable approaches or exceeds the safe limits, its colour changes to either yellow, indicating an anomaly, or red, for warning.
The system was verified using the case study of an underground coal mine and could simultaneously interpret gas monitoring data to develop a warning system.
“It can turn hazard data into a visual alarm system,” said Professor Shafiabady who collaborated with University of Technology, Sydney, and Shanxi Normal University researchers, China, on the project.
FULL STORY